Riyadh has more jobs and higher rents. Jeddah has cheaper flats and better returns for landlords. In one month, 6,366 job listings named Riyadh against 2,684 for Jeddah. An average flat rents for 2,604 SAR a month in Riyadh and 2,060 SAR in Jeddah. To buy, a Riyadh flat costs 6,164 SAR per m² against 3,760 SAR in Jeddah, which is why a Jeddah flat earns a gross rental yield of 5.6% a year against 4.5% in Riyadh.
The job figures come from public listings collected between September 12 and October 12, 2026. The housing figures are averages from the Real Estate General Authority (REGA): every registered sale and every Ejar rent contract between April 2025 and March 2026.
Riyadh vs Jeddah at a glance
| Riyadh | Jeddah | |
|---|---|---|
| Job listings in 30 days | 6,366 | 2,684 |
| Share of all Saudi job listings | 35.5% | 15.0% |
| Monthly rent, flat | 2,604 SAR | 2,060 SAR |
| Monthly rent, studio | 1,716 SAR | 1,356 SAR |
| Monthly rent, villa | 9,038 SAR | 7,146 SAR |
| Price per m², flat sold | 6,164 SAR | 3,760 SAR |
| Average flat sold | 875,000 SAR (142 m²) | 612,000 SAR (163 m²) |
| Average villa sold | 2,113,000 SAR | 2,131,000 SAR |
| Gross rental yield, flat | 4.5% | 5.6% |
| Years of rent to equal a flat's price | 22.3 | 17.9 |
Jobs: Riyadh has 2.4 times more listings
Riyadh is where most Saudi jobs are posted. Of the 17,941 Saudi job listings in our 30-day sample, 6,366 named Riyadh (35.5%) and 2,684 named Jeddah (15.0%). Among listings that named a city at all, Riyadh had 47% and Jeddah 20%.
That still leaves Jeddah as the clear second job market, ahead of Al Ahsa (985 listings) and Makkah (935). Engineering and IT are the largest job categories in the country, at about 12% of listings each, and only 7.3% of Saudi listings showed a salary, so ask early in the process.
Renting: Riyadh costs about 26% more
An average flat rents for 2,604 SAR a month in Riyadh and 2,060 SAR in Jeddah, 26% more in the capital. The gap holds for every type of home: a studio costs 1,716 SAR against 1,356 SAR, and a villa 9,038 SAR against 7,146 SAR.
Per m², a year of rent costs 276.7 SAR in Riyadh and 210.2 SAR in Jeddah. Riyadh has the highest flat rents of the ten largest Saudi cities.
Buying: Jeddah flats cost 39% less per m²
A flat sold in Jeddah cost 3,760 SAR per m² on average, against 6,164 SAR in Riyadh. Jeddah flats are also bigger: the average flat sold measured 163 m² against 142 m² in Riyadh, so the average Jeddah flat (612,000 SAR) still cost 263,000 SAR less.
Villas are the exception. The average villa sold cost about the same in both cities, 2.11 million SAR in Riyadh and 2.13 million in Jeddah. The markets also sell different things: in Riyadh, flats were 13,100 of the registered residential sales and villas 7,080; in Jeddah, flats were 17,015 and villas only 1,717.
Rental yields: Jeddah returns more per riyal
Put the rent and the price together and Jeddah comes out ahead for landlords. A Jeddah flat earns a gross rental yield of 5.6% a year; a Riyadh flat earns 4.5%. That is 17.9 years of rent to pay back a Jeddah flat and 22.3 years in Riyadh. The reason: per m², a Riyadh flat costs 64% more than one in Jeddah, but it rents for only 32% more.
Across the ten largest cities, Jeddah has the second highest yield. Only Jubail does better, at 7.1%: it has the lowest price per m² of the ten cities, and its rents are still higher than in Makkah or Madinah. Makkah has the lowest yield, 3.0%, and the national average is about 4.8%.
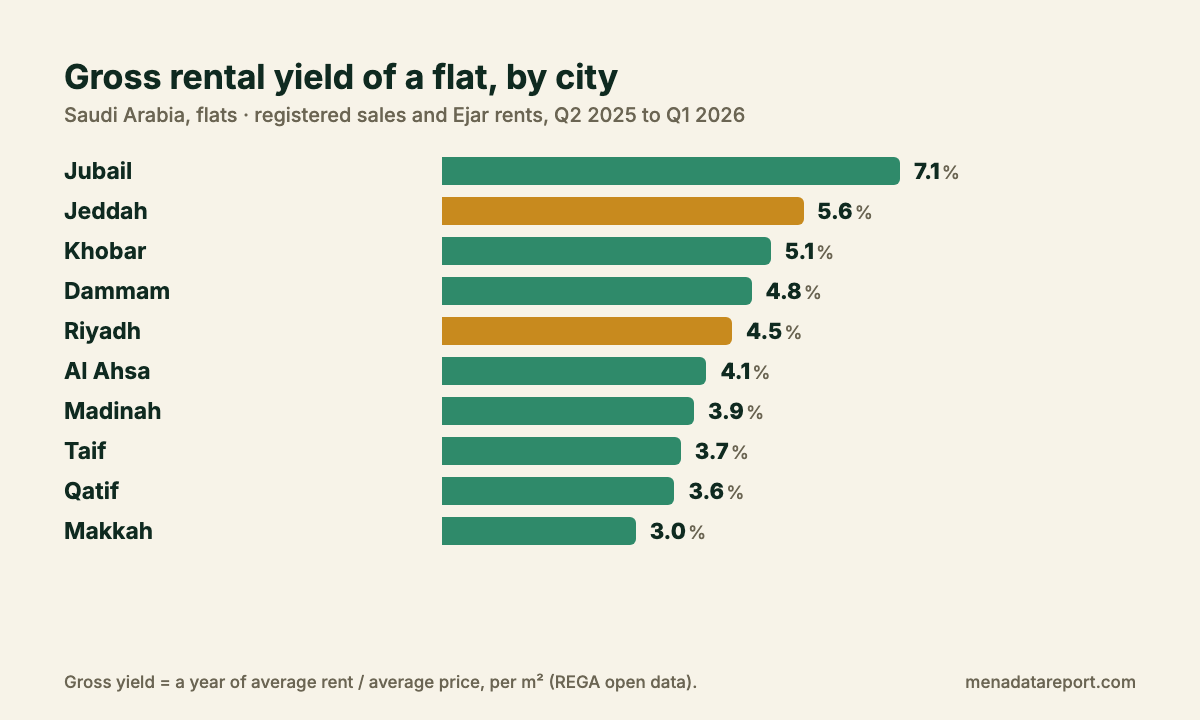
Gross yield here is a year of average rent per m² divided by the average sale price per m². It is before service charges, maintenance, vacancy and agent fees, so the net return an owner keeps is lower in both cities.
Riyadh, district by district
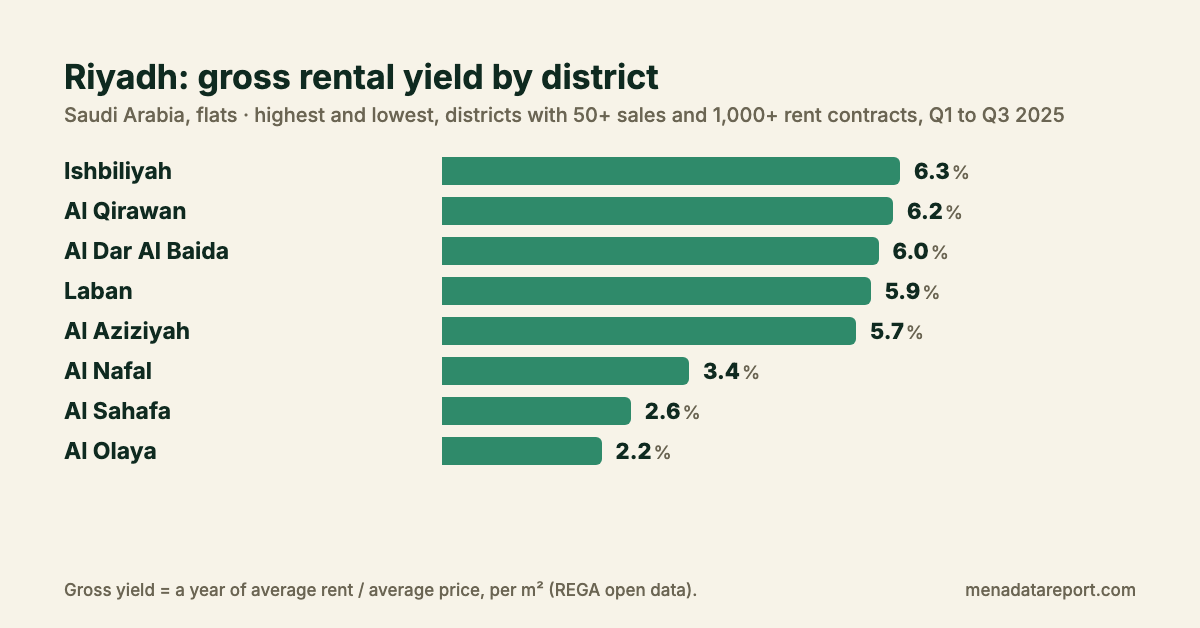
Inside Riyadh the spread is wide. Prime central districts have the lowest yields: in Al Olaya, a flat sells for 18,532 SAR per m² and returns about 2.2% a year, which means 46 years of rent to cover the price. Al Sahafa, in the north, returns 2.6%.
The highest yields are in districts where flats are cheaper but still rent well. Ishbiliyah in the east returns 6.3%, Al Qirawan 6.2%, and Al Dar Al Baida in the south 6.0%, where a flat sells for 3,104 SAR per m², a sixth of the price in Al Olaya.
Jeddah, district by district
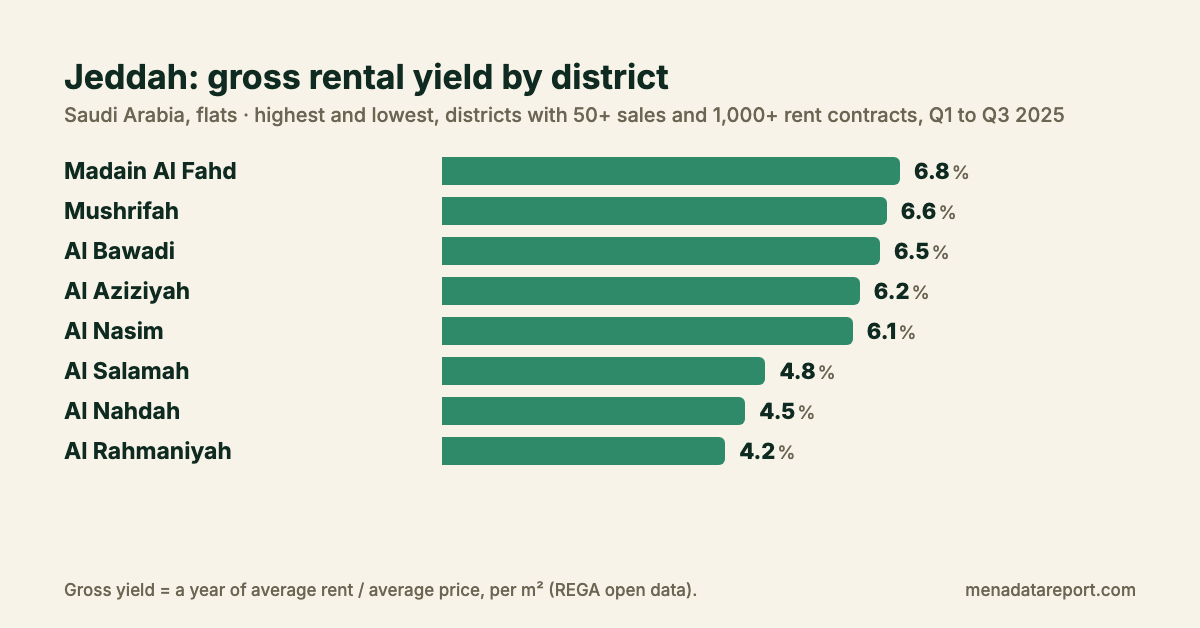
Jeddah's districts sit in a narrower band. The highest yields are in Madain Al Fahd (6.8%), Mushrifah (6.6%) and Al Bawadi (6.5%). The lowest are in Al Nahdah (4.5%), where a flat sells for 6,218 SAR per m², and Al Rahmaniyah (4.2%). Even Jeddah's lowest-yield districts return close to the Riyadh city average of 4.5%.
Prices are moving in different directions
The registered average price per m² of a flat sold in Riyadh went from 6,637 SAR in Q2 2025 to 5,856 SAR in Q1 2026, about 12% lower. In Jeddah it went from 3,737 SAR to 3,930 SAR over the same quarters, about 5% higher. An average moves when the mix of flats sold changes, not only when prices change, so these figures show what was registered, not a price index.
| Average price per m² of a flat sold | Riyadh | Jeddah |
|---|---|---|
| Q1 2024 | 6,058 SAR | 3,871 SAR |
| Q2 2025 | 6,637 SAR | 3,737 SAR |
| Q4 2025 | 5,729 SAR | 3,658 SAR |
| Q1 2026 | 5,856 SAR | 3,930 SAR |
So which city?
- Moving for work: Riyadh has 2.4 times more job listings, but expect about 26% more rent for the same type of home.
- Renting on a budget: Jeddah is cheaper for every type of home, from studios to villas.
- Buying a flat to live in: Jeddah flats cost 39% less per m² and are bigger on average.
- Buying to rent: Jeddah returns more per riyal (5.6% against 4.5%). In Riyadh, the district matters more than the city: from 2.2% in Al Olaya to 6.3% in Ishbiliyah.
The full reports: Saudi Arabia real estate: prices and rents from registered deals and the Saudi Arabia job market.
Limits
- Jobs are listings, not hires. The job counts are public listings on Tanqeeb, a job aggregator, over 30 days. One job can be posted on several boards, and 19% of Saudi listings named no city.
- Gross, not net. Yields are before fees, maintenance, vacancy and taxes.
- Averages, not medians. REGA publishes group averages (total value divided by total area), not single deals, so a few large sales can lift a district.
- Different homes. Sale and rent averages describe the homes that were sold and the homes that were rented, which are not the same homes. The yield is computed per m² to limit this.
- Ejar includes renewals. Rent contracts are all registered contracts, new and renewed, so they can differ from the asking rent of a new lease.
- Different periods. Jobs cover September 12 to October 12, 2026. City housing figures cover Q2 2025 to Q1 2026; district figures cover Q1 to Q3 2025, for districts with at least 50 flat sales and 1,000 rent contracts.
How the data is collected and averaged: method.